
About
Hello, I'm Annabelle Zhu — a data-driven creator passionate about turning complex ideas into impactful digital experiences. With a strong foundation in data science, web development, and UX/UI design, I blend technical precision with creative thinking, holding a Master degree in Data Science. I am dedicated to further enhancing my technical expertise and analytical skills. Known for my effective leadership style, critical thinking abilities, and strong sense of teamwork, I bring a proactive approach to problem-solving and am committed to delivering excellence in every project. I’m passionate about exploring new opportunities and collaborating with like-minded professionals to drive meaningful contributions in data science and beyond.
Personal Info
- Birthday: 26 July 2001
- City: Shanghai, China
- Phone: +86 176-2180-0415
- Age: 24
- Degree: BA
- Email: 0realannabelle0@gmail.com
- Work Type: Remote
Data Analyst & UX/UI Designer | Transforming Data and Design into Impact

I’m a data-driven creator with a passion for turning information into insights and interfaces into experiences. With a strong background in programming, data analysis, and UX/UI design, I specialize in leveraging tools like Python, R, SQL, Tableau, and Adobe XD to interpret complex data, design intuitive solutions, and build engaging digital products.
Currently pursuing my Master’s in Data Science, I bring together technical expertise and creative thinking to solve real-world problems. I’m known for my clear communication, collaborative spirit, and relentless curiosity — always eager to learn, lead, and contribute meaningfully to every project I take on.
Skills
Resume
I am a detail-oriented data analyst with a strong academic background in UA. I am committed to leveraging my analytical skills and knowledge to drive data-driven decision-making and contribute meaningfully to business success.
Summary
Annabelle Zhu
A diligent graduate student in Data Science, seeking an opportunity to apply my robust technical skills and knowledge in a dynamic work environment. Proficient in web development and design, and well-versed in advanced statistical methodologies and data visualization. I bring a proven ability to perform efficient data analysis using various software applications. An autonomous, motivated professional with excellent communication, interpersonal, and time management skills. Committed to contributing individually and collaborating effectively in a team setup.
Education
University of Arizona
Jan 2025 - Dec 2025
Master of Science - MS, Data Science
University of Arizona
Aug 2022 - Dec 2024
Bachelor of Arts - BA, Information Science & eSociety
Minors: Math, Thematic
GPA: 3.92/4
Eynesbury Institute of Business and Technology
Diploma, Computing and Information Technology
Jun 2021 - Jan 2022
Grade: 6.25/7
Songjiang No.2 High School
High School
Sep 2017 - Jan 2019
Languages
English
Expert
Mandarin
Native
Soft Skills
Effective Communication
Team Collaboration
Time Management
Intercultural Communication
Emotional Intelligence
Experience
Xindao Software (Jiangsu) Co., Ltd 01/2024 - Present
Freelance UI/UX & Brand Designer
- Designed a professional logo and visual brand identity aligning with corporate values and modern aesthetics. using Illustrator.
- Created interactive prototypes and UI components using Adobe XD, showcasing product structures and process visualization of MES system.
Cooledtured Collections 07/2024 - 09/2924
Data Research Analyst
- Collected, cleaned, and organized data to ensure accuracy
- Conducted data analysis and created visualizations to generate insightful reports
- Contributed to the development and improvement of data-driven processes by staying updated on industry trends and best practices
- Communicated data-driven recommendations based on an understanding of metrics and business goals
The Global Tech 01/2024 - 05/2024
Data Analyst Trainee
- Utilized SQL to extract and analyze data, presenting findings through interactive visualizations in Tableau and producing comprehensive reports for internal stakeholders
- Gained insights into global business strategy by using data techniques such as exploratory data analysis, summary statistics, and visualization.
- Conducted data analysis and visualization of website data for grammy.com (by the Recording Academy)
- Communicated data-driven recommendations based on an understanding of metrics and business goals
The Global Tech 06/2023 - 12/2023
Web Developer Trainee
- Reviewed quantitative and qualitative user research and identified themes inform future product development.
- Created interactive prototypes of Marriott Bonvoy Hotels and Villas and Sprinkles Cupcakes
- Developed and maintained a comprehensive portfolio showcasing web development projects, including interactive prototypes, third-party API integrations, and creative marketing strategies
Shanghai Longmai Industrial Co., Ltd 06/2023 - 12/2023
Marketing Specialist
- Develop and execute creative marketing strategies to enhance brand visibility.
- Manage social media platforms, engaging with the audience and creating compelling content, contributing to a 12% increase in sales revenue.
- Analyze and report on key performance indicators to measure the success of marketing efforts, leading to a 20% improvement in marketing campaign effectiveness.
Honors & Awards
Summa Cum Laude
Dec 20, 2024
Issued by University of Arizona
To be eligible for Latin Honors at graduation, bachelor's degree candidates must have completed at least 45 graded units of University Credit with letter grades that carry the required grade-point-average of 3.9-4.0
Dean's List of Distinguished Scholars
Dec 19, 2024
Issued by University of Arizona
Dean’s List recognition is awarded based on 12 units and a 4.000 grade-point-average
Academic Year Highest Academic Distinction
May 09, 2024
Issued by University of Arizona
Academic Year Highest Academic Distinction recognition is awarded a 4.000 grade point average
Dean's List with Distinction - Full Time
May 09, 2024
Issued by University of Arizona
Dean’s List recognition is awarded based on 12 units and a 4.000 grade-point-average
Dean's List With Distinction
Dec 14, 2023
Issued by University of Arizona
Dean's List with Distinction -- is based on 15 units and a 4.000 grade-point-average.
Honorable Mention
Nov 05, 2023
Issued by University of Arizona
Honorable Mention -- is based on 12 units of 3.500 and above grade-point-average
Licenses & Certifications
Data Science & Visualization Undergraduate Certificate
2024
Issued by University of Arizona
The Data Science and Visualization Certificate provides undergraduate students need in data collection, exploration, manipulation and storage, analysis and presentation in order to navigate data-rich workplace environments.
University of Arizona - Coding for Data Track
2024
The recipient of this certificate has demonstrated skills in data analysis by completing professional-level projects using SQL and Python.
Intel Project - Data Analysis for Sustainability
2024
Certificate recipient has successfully completed a real Data Analysis project for Intel’s Sustainability team.
Intercultural Skills
2023
 Badge recipient has demonstrated intercultural skills and the ability to interact effectively
and appropriately with diverse team members in an online environment.
Badge recipient has demonstrated intercultural skills and the ability to interact effectively
and appropriately with diverse team members in an online environment.
Website Portfolio
With a strong portfolio of diverse projects that showcase my proficiency in the fields of web development, Research and Development as well as Innovation . These projects highlight my expertise in various technologies and methodologies, underscoring my ability to tackle complex challenges effectively.
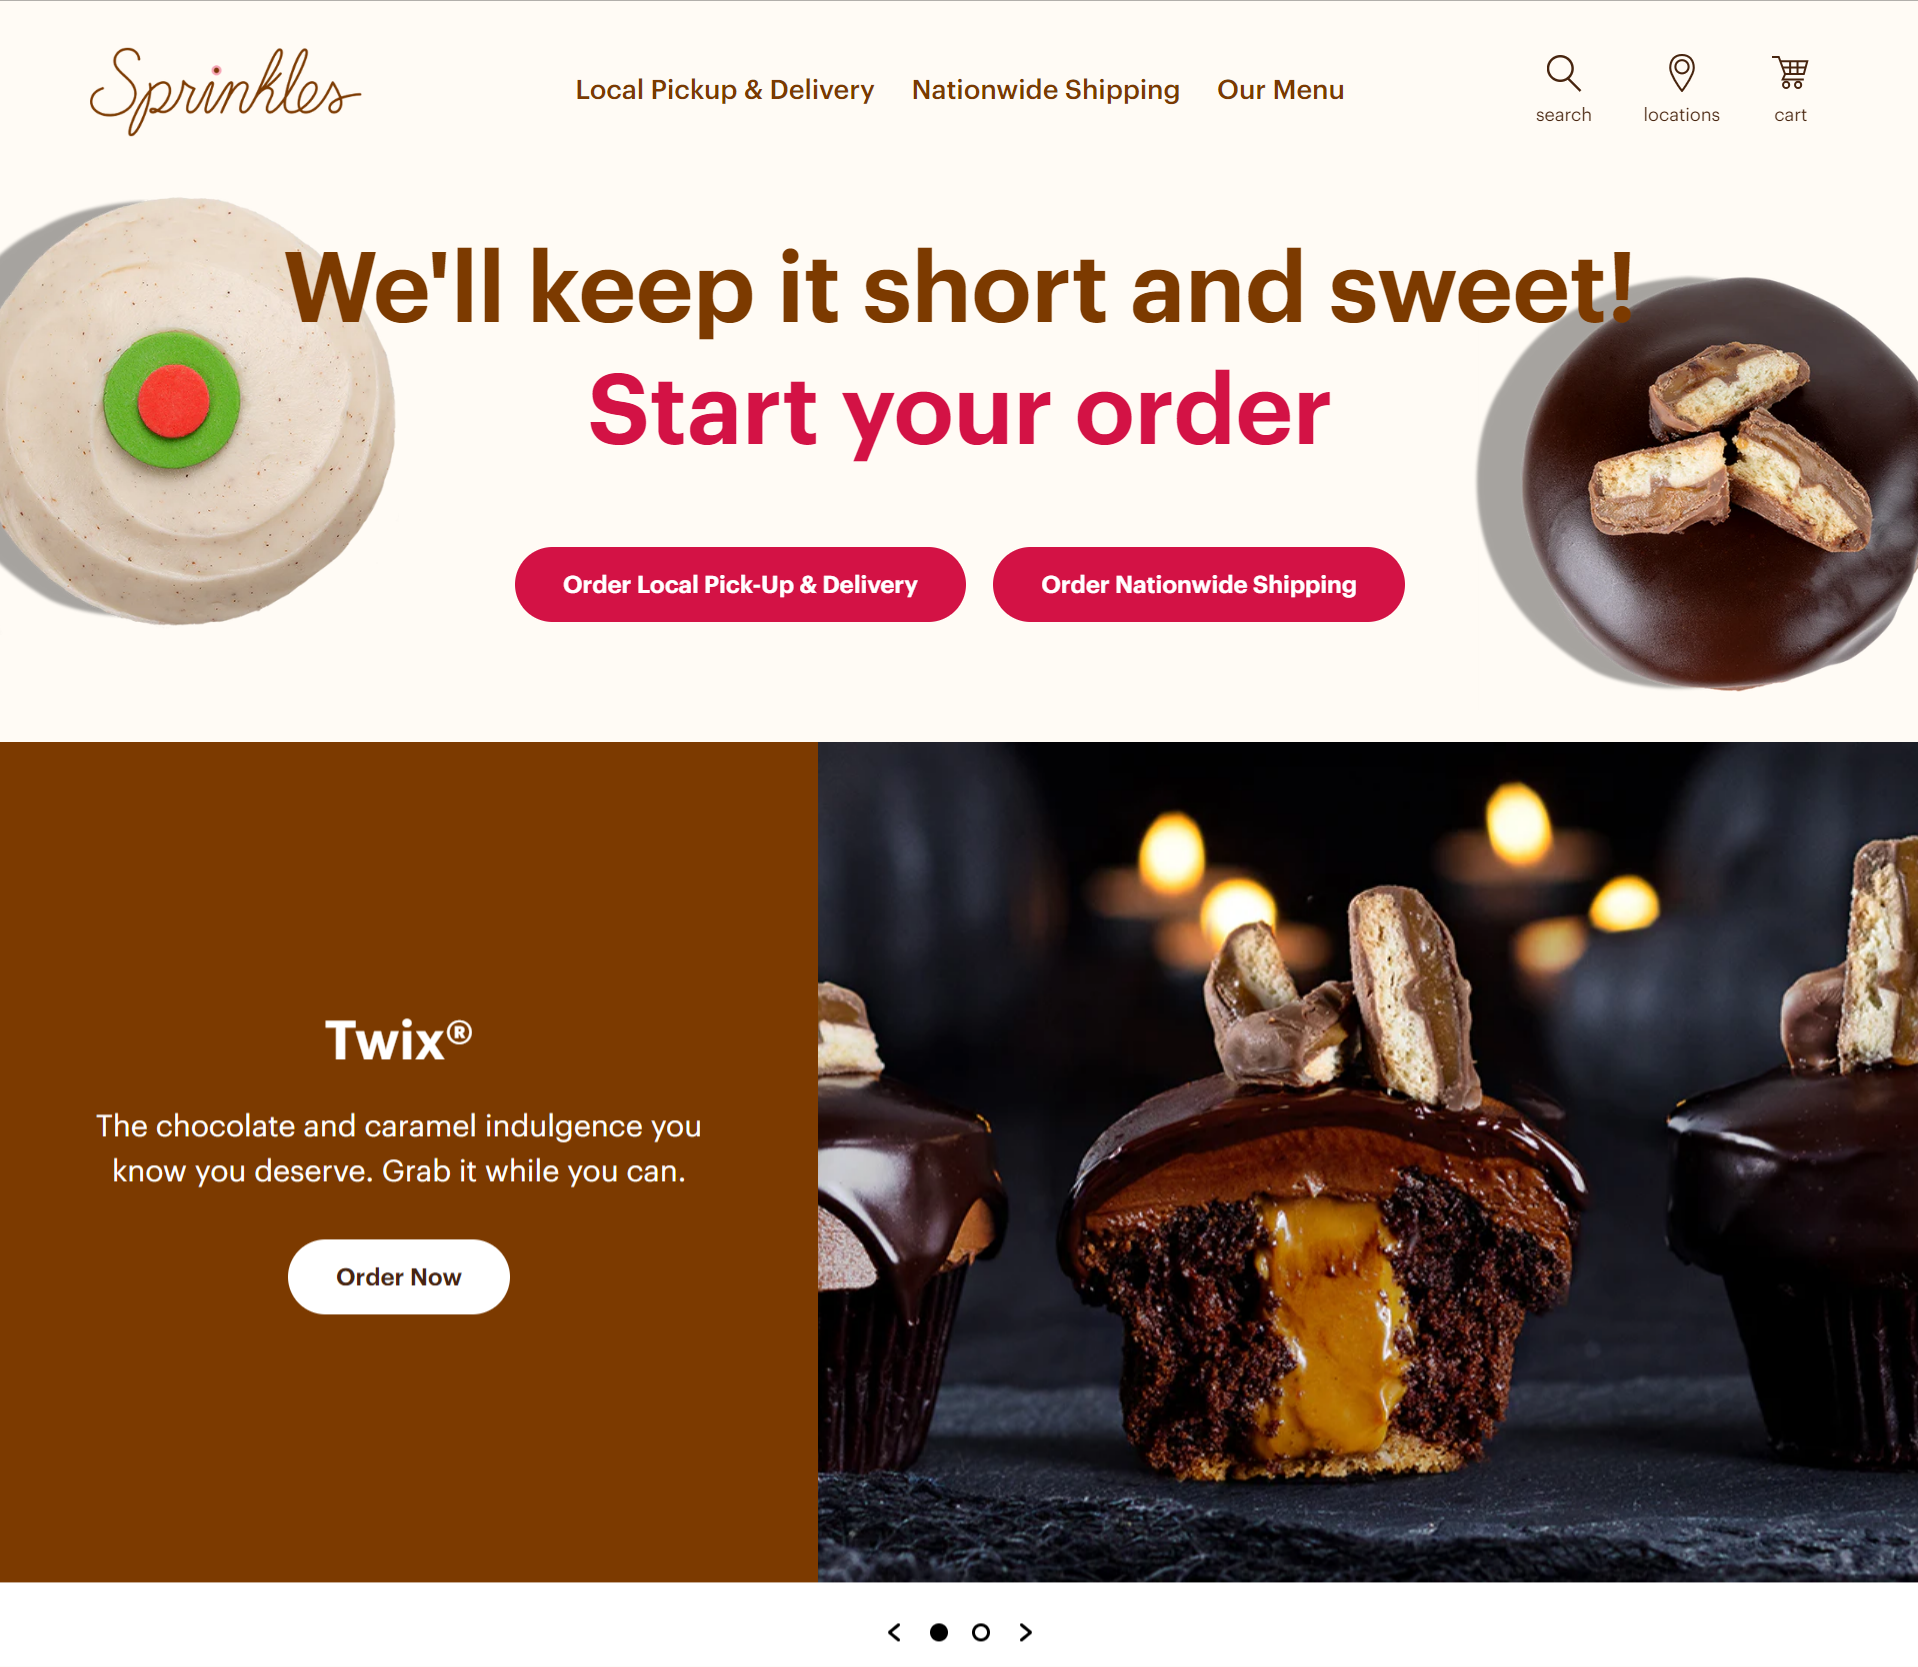
Sprinkles Cupcakes

Discover Your Dream Getaway: Marriott Bonvoy Hotels and Villas
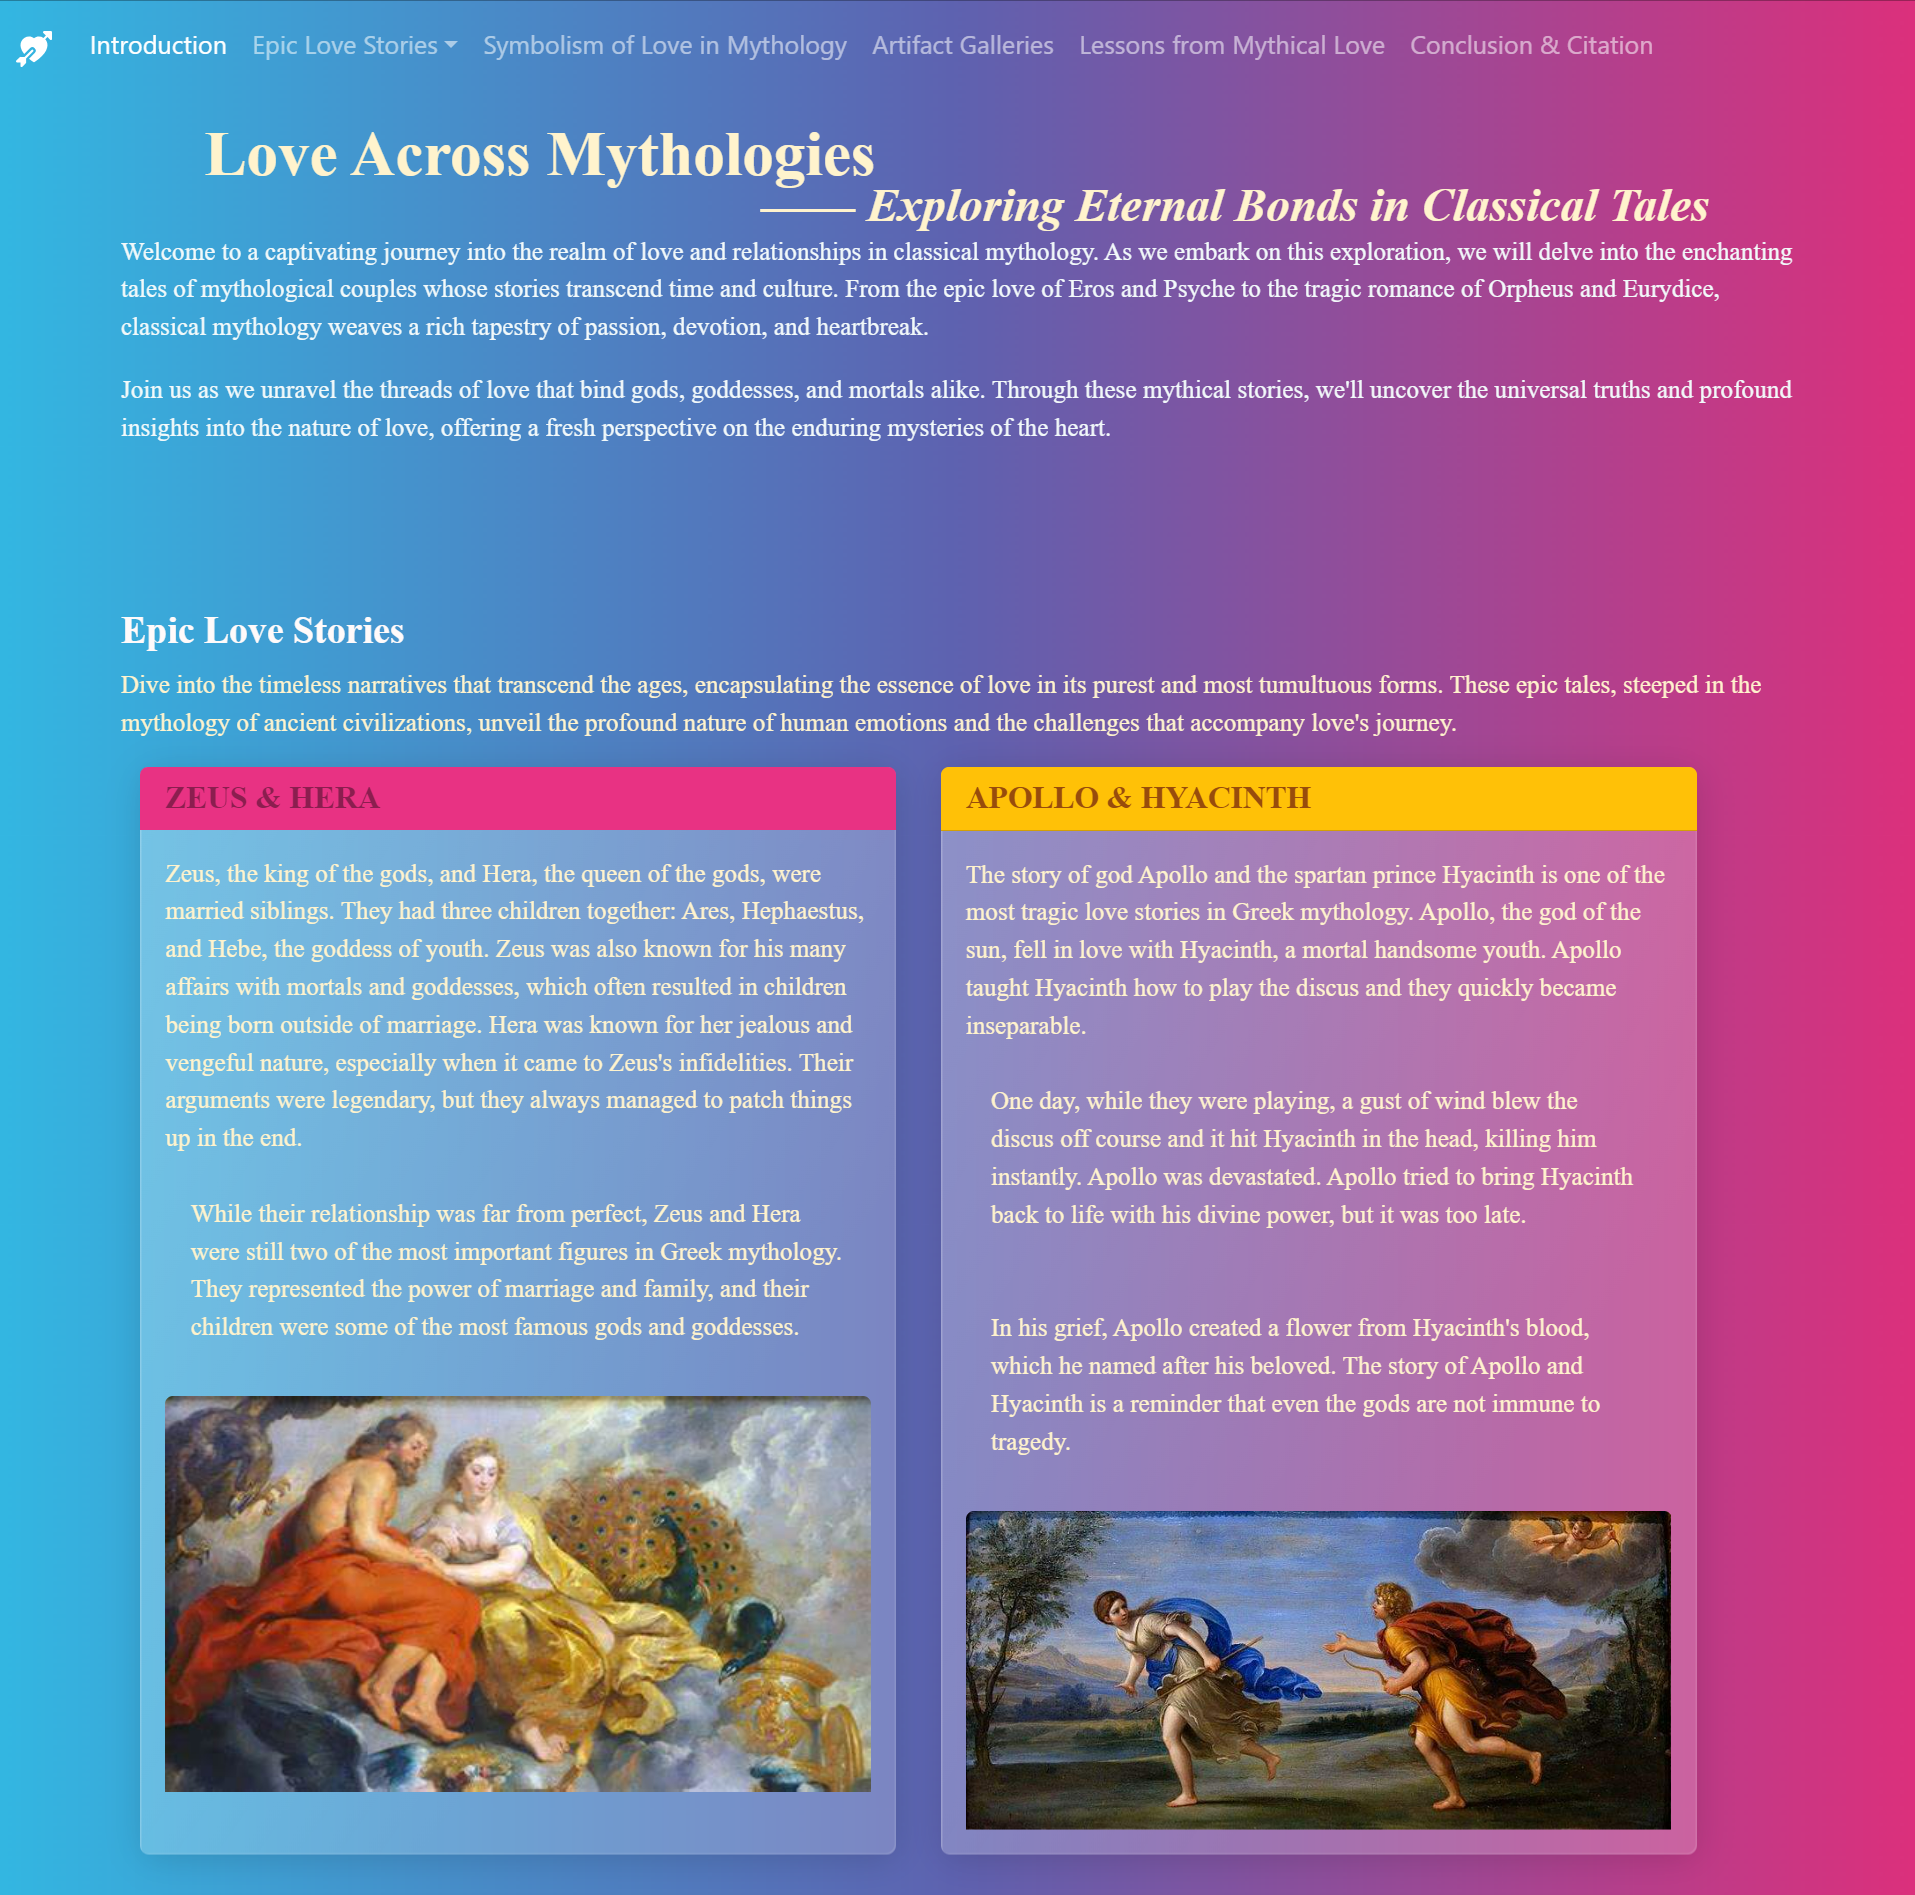
Love Across Mythologies—— Exploring Eternal Bonds in Classical Tales
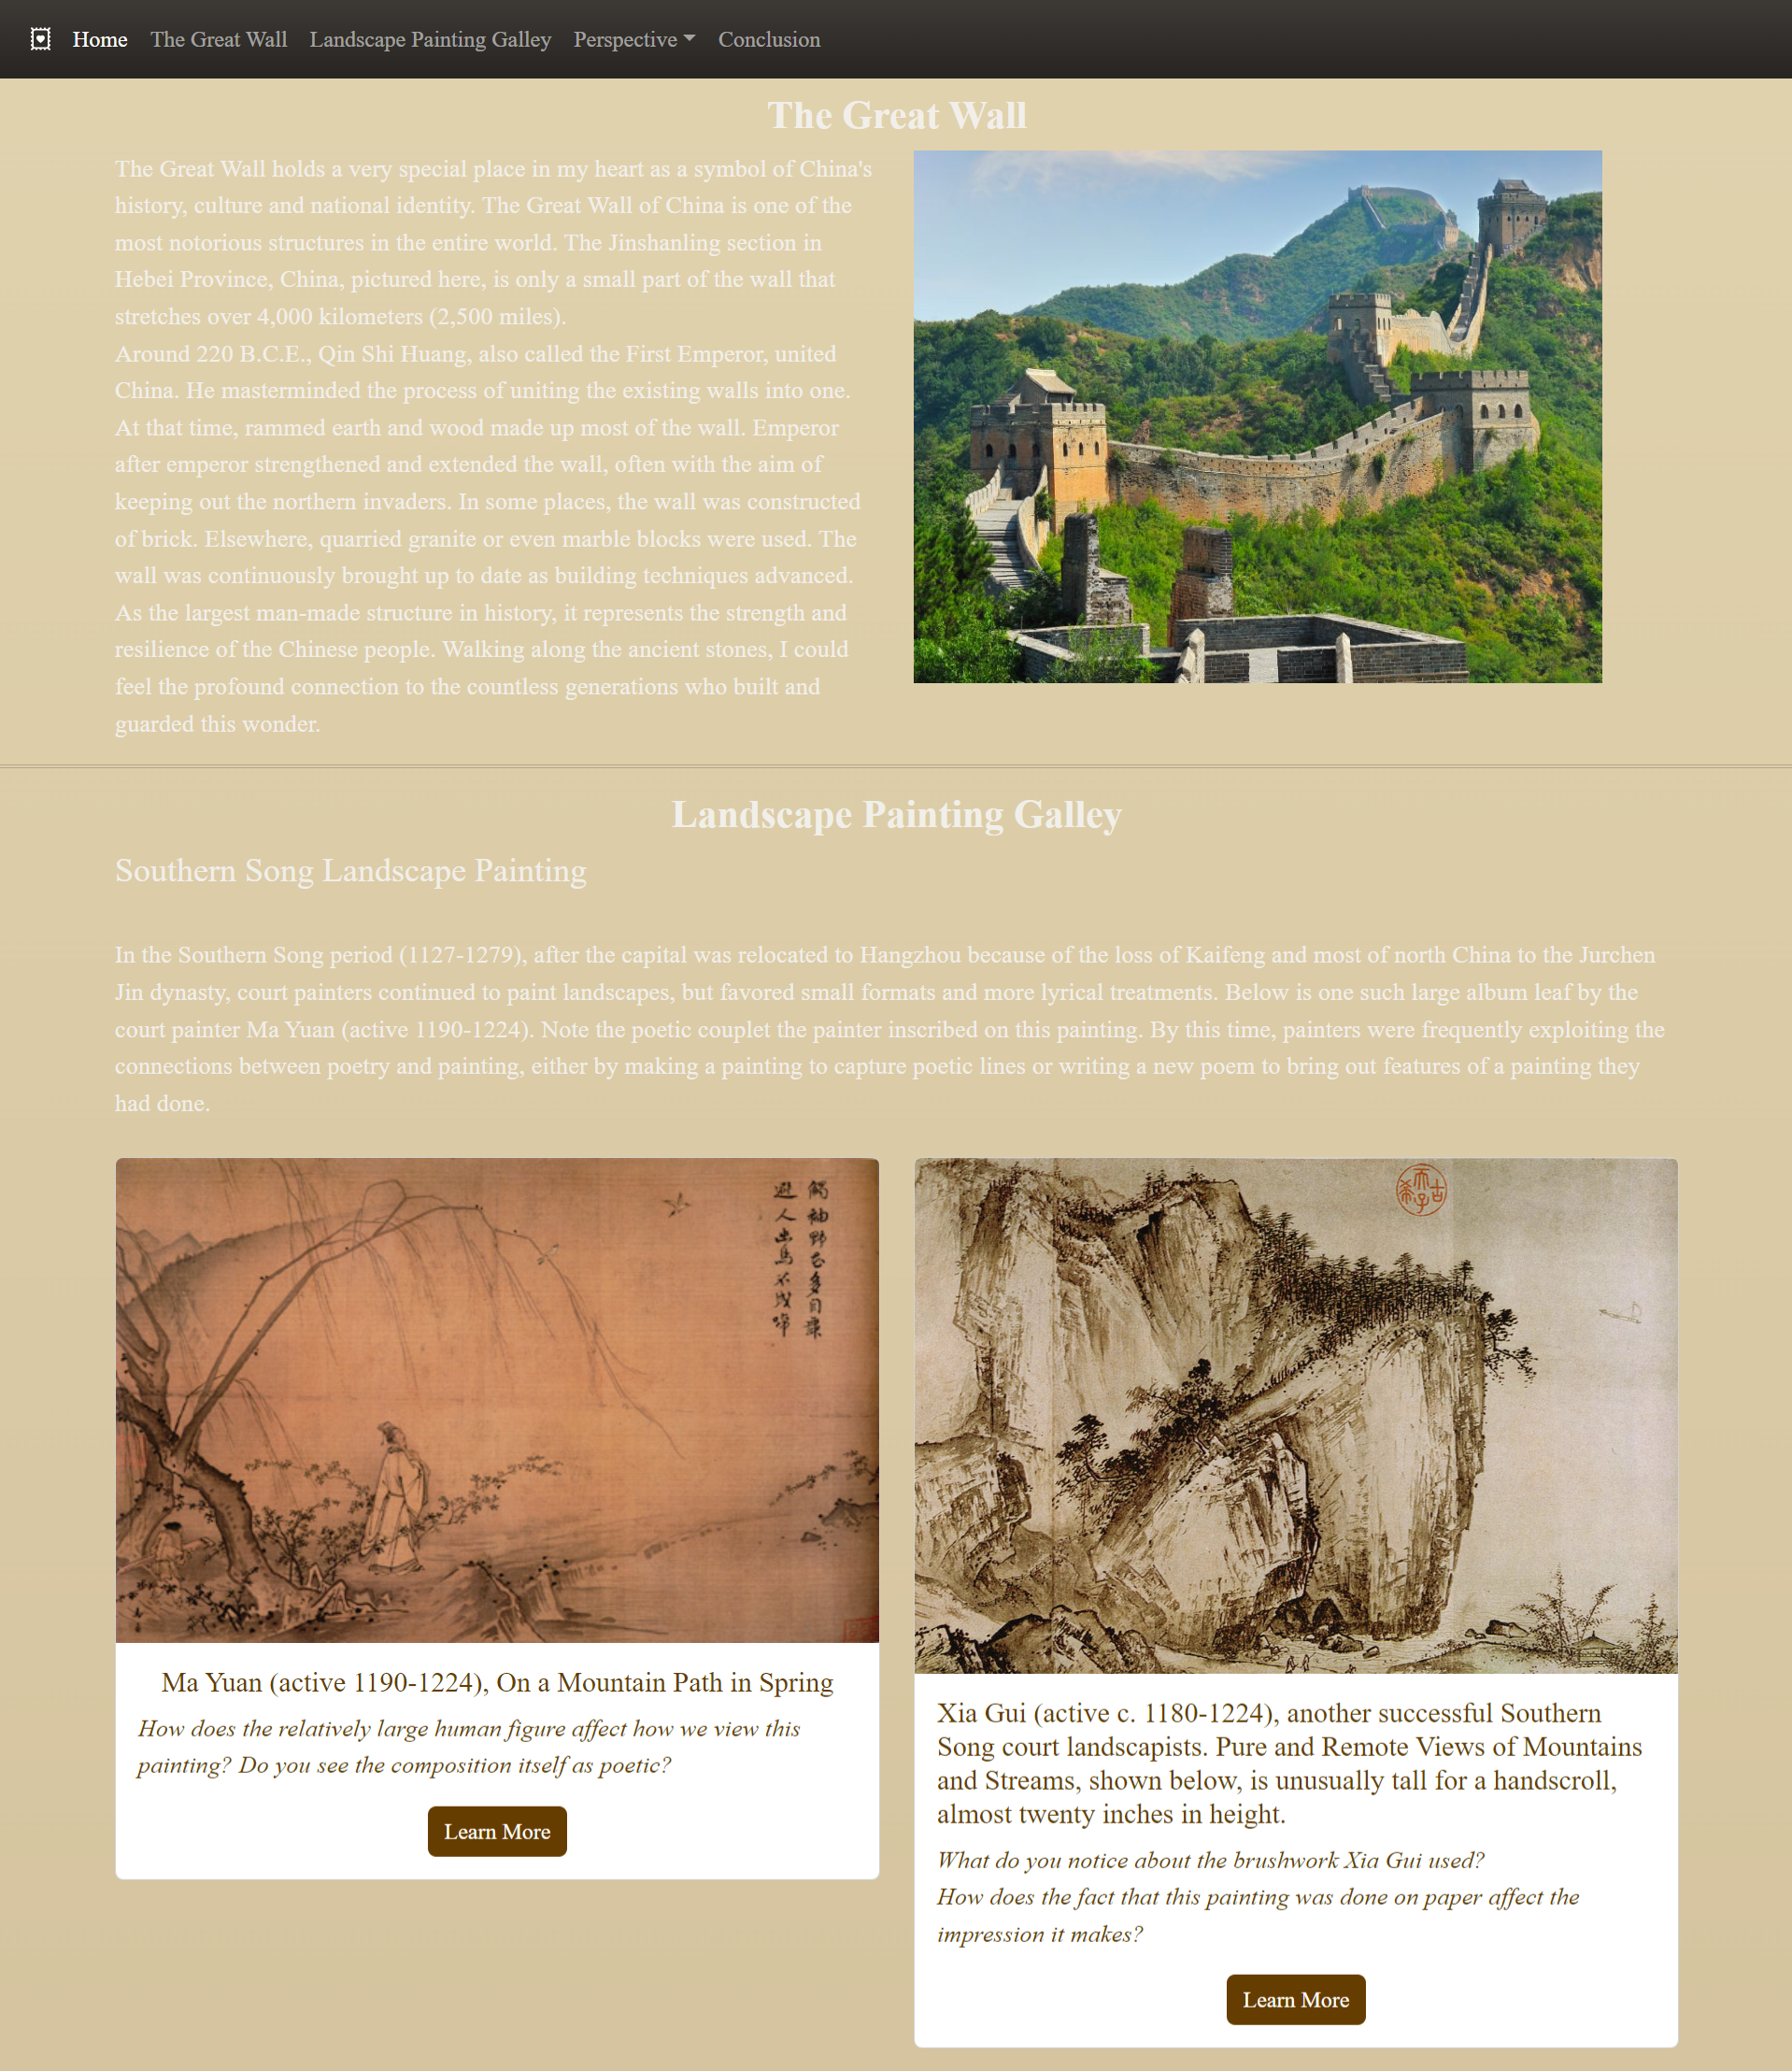
Asian visual culture
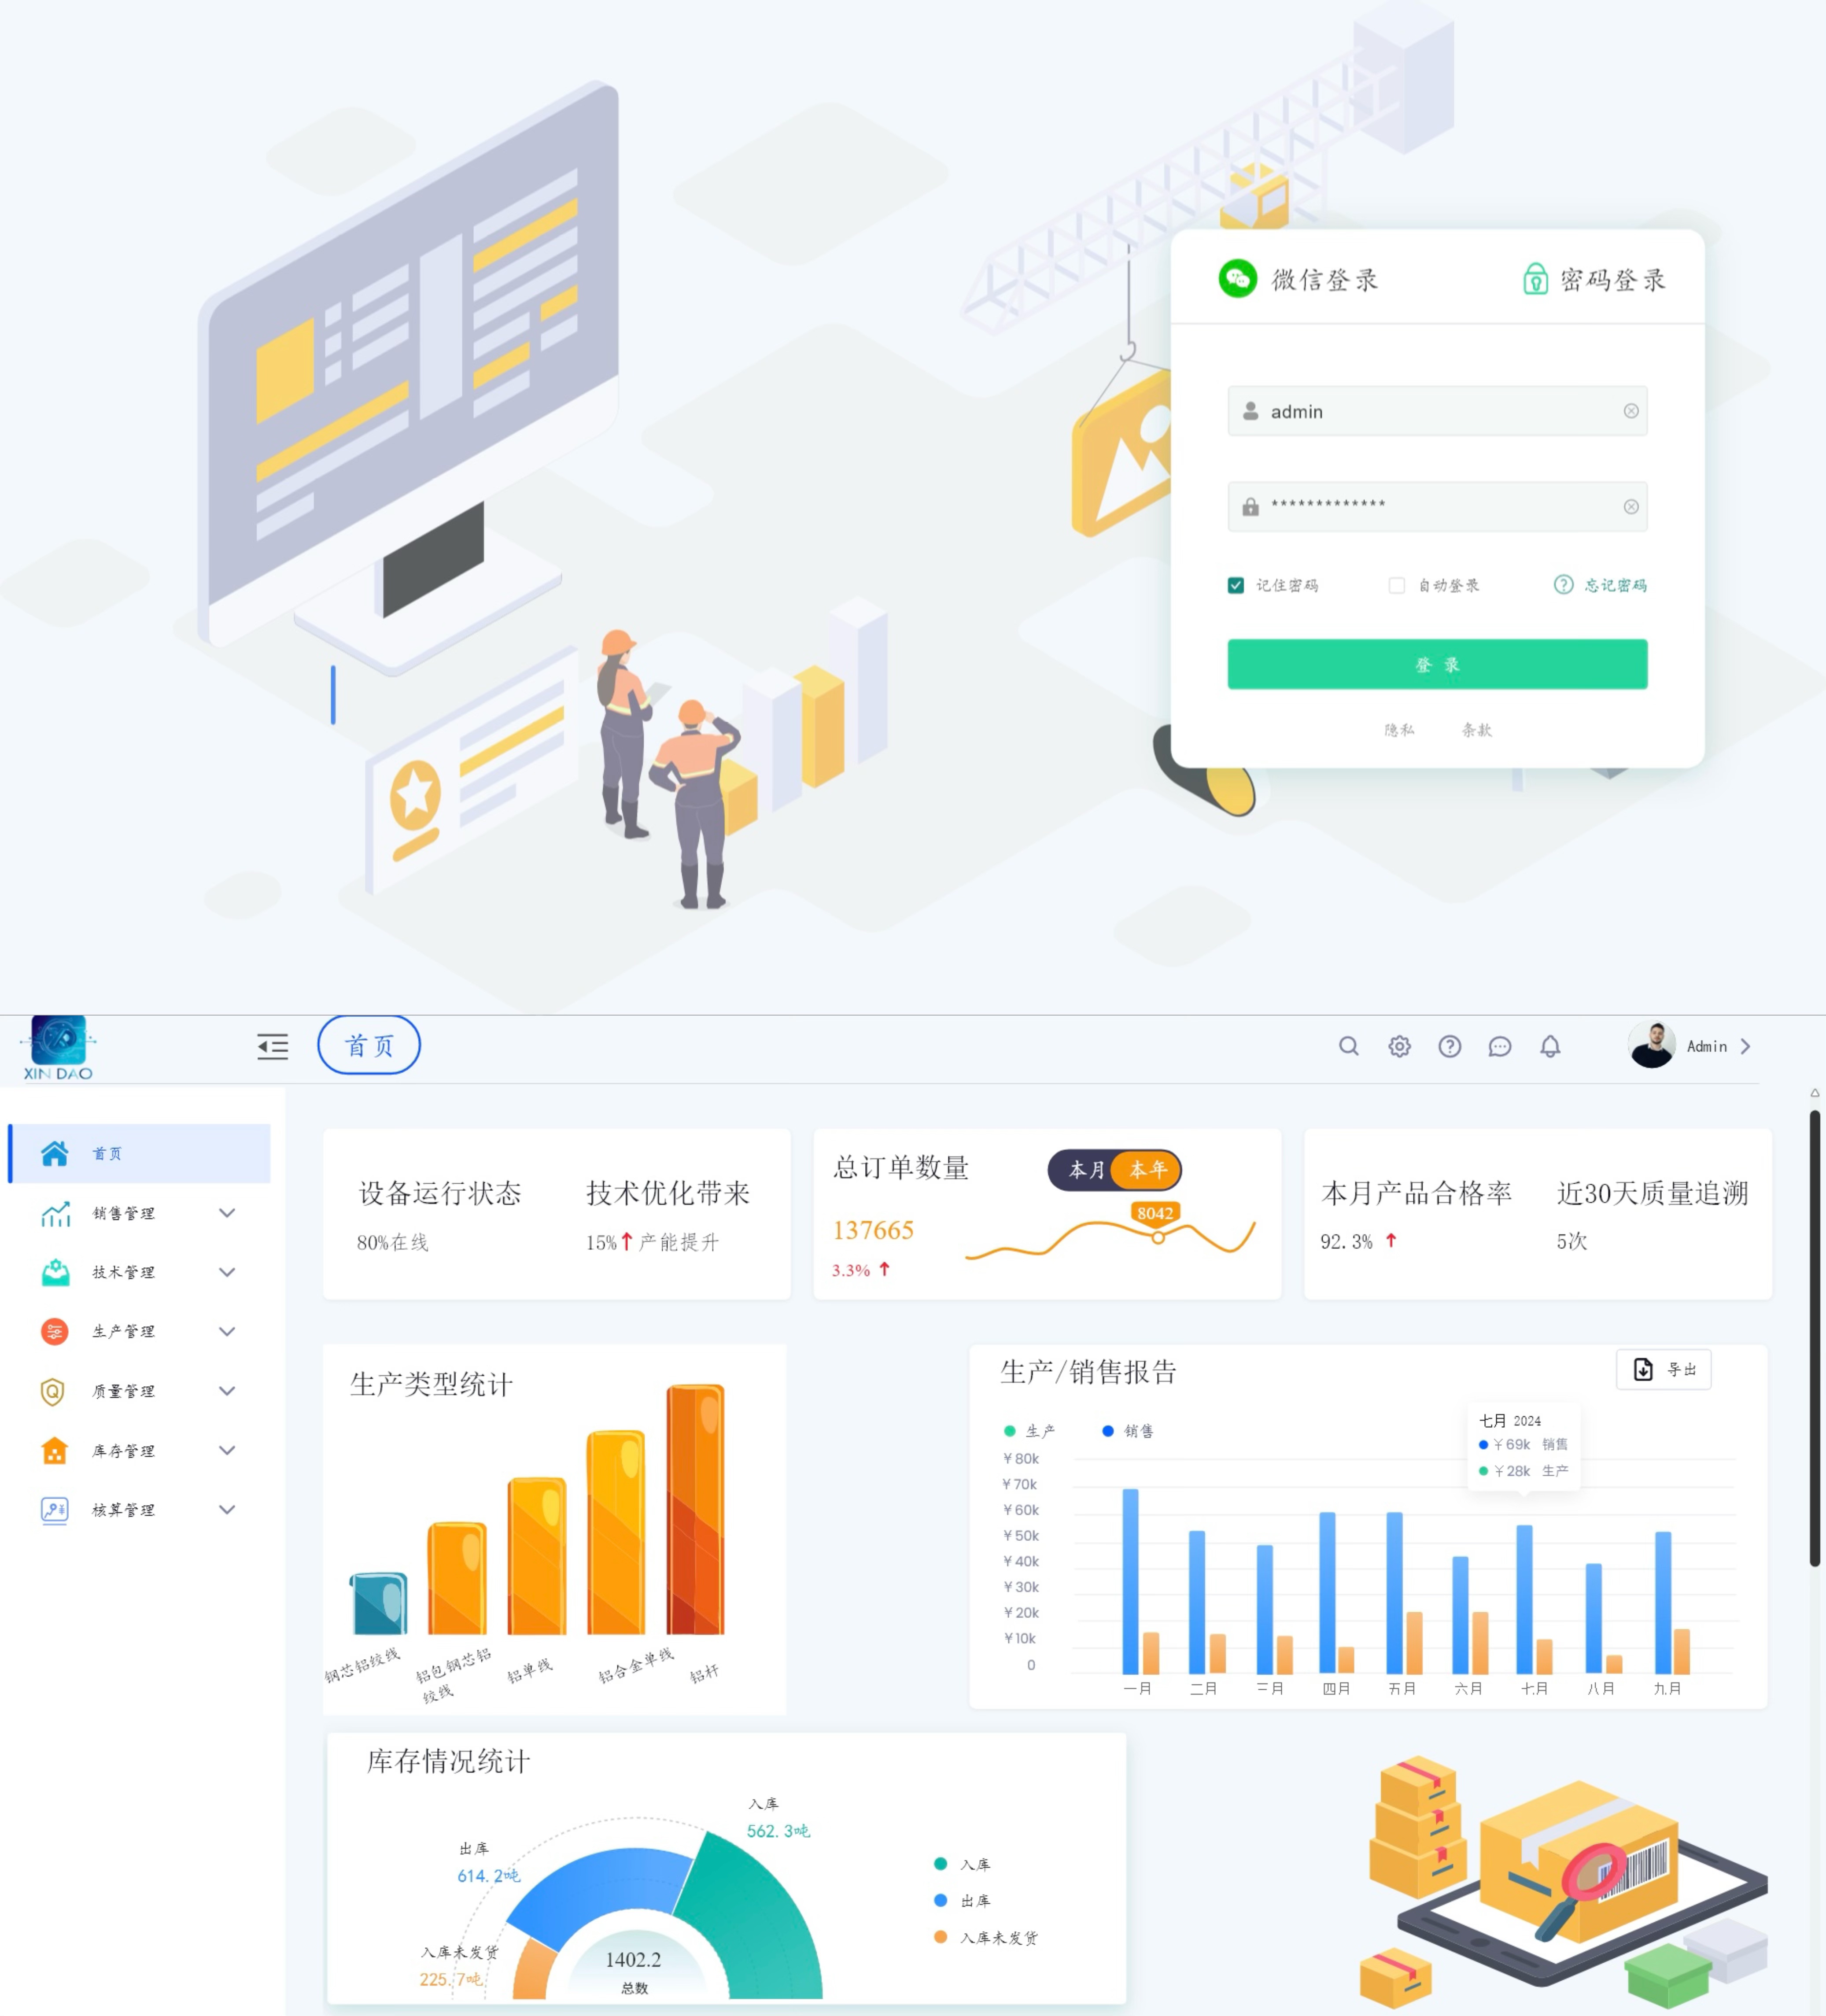
UX/UI Portfolio
This UX/UI project showcases my ability to design intuitive and efficient enterprise-level systems using Adobe XD. I designed a comprehensive management platform that includes modules for sales, production, technical support, inventory, quality control, and cost accounting. The interface emphasizes usability and clarity, featuring logical navigation, visually distinct icons, and scalable interaction patterns. This project demonstrates my strength in user-centered design, system architecture planning, and visual communication—bridging data, function, and form for real-world business needs.
Data Science Projects
Data Visualization Portfolio
Tools: R | ggplot2 | networkD3 | Sankey Diagrams | Interactive Visualizations
This portfolio showcases advanced data visualization techniques applied to diverse public sector datasets. Highlights include:
- A Sankey diagram analyzing occupational fatalities by industry and cause
- Time-series visualizations of Japan's industrial diamond trade
- Spatial analysis of sewage spills across New York water bodies
- Decadal trends in workplace safety and precious metals trade
Analysis of Student Performance in Secondary Education
Tools: R | Machine Learning | Statistics | Data Visualization
This project analyzes factors affecting Mathematics performance in secondary school students. Using data from the UCI Machine Learning Repository, we apply statistical tests and machine learning models to assess influences like gender, relationship status, study time, and family background. The findings offer insights to support targeted educational interventions and improve student outcomes.
Predicting Corporate Bankruptcy
Tools: R | Data Visualization | Machine Learning
In this project, we aim to build a machine learning model to predict company bankruptcy based on financial ratios from Taiwanese companies between 1999 and 2009. Using classification techniques, the goal is to analyze which financial factors are most predictive of bankruptcy. The project involves thorough data exploration, preprocessing, and the comparison of three machine learning models: Desicion Trees, Random Forest and k-nearest neighbors. These models will be cross-validated to evaluate performance, and their results will be analyzed to determine which is most effective at predicting company insolvency.
Leveraging Movie and Anime Popularity Data for Strategic Marketing in Pop Culture Merchandise
Tools: Python | Pandas | Jupyter Notebook | Machine Learning
This project aims to enhance Cooledtured's marketing strategies by analyzing movie and anime popularity data to identify key factors influencing viewer ratings and segmenting customers for targeted marketing.
The project equips Cooledtured with data-driven insights to refine their product offerings and marketing efforts, ultimately driving higher engagement and sales in the pop culture merchandise market.
Predicting Amazon Figure Prices
Tools: Python | Pandas | Jupyter Notebook | Machine Learning
To develop a machine learning model that predicts the prices of figurines sold on Amazon based on various features such as customer reviews, brand, availability, and ratings, with the goal of optimizing pricing strategies and improving sales.
Grammy Website Analytics
Tools: Python | Pandas | Jupyter Notebook
In this comprehensive data analysis project, I explored the digital footprint of the Grammy Awards website, uncovering crucial insights from web analytics data. The project covered diverse dimensions, including website performance, audience demographics, and the influence of significant events like the Grammy Awards ceremony.
🚀 From dissecting daily visitor trends to understanding the impact of the Grammy Awards ceremony, this project was a journey into the heartbeat of one of the music industry's most iconic events. 💻🎤
Starbucks RFM Analysis
Tools: Python | Pandas | Jupyter Notebook | Tableau
In this project, I focus on optimizing marketing strategies through RFM (Recency, Frequency, Monetary) analysis. Leveraging Python and Tableau, I delved into customer purchase behavior, exploring how recently customers made purchases, how often they buy, and the monetary value of their transactions. 📈
Energizing Growth Selecting an Optimal Location for Intel's Sustainable Data Center
Tool: SQL | Tableau
Explore the dynamic world of energy production and sustainability with our recent project in collaboration with Intel. Leveraging SQL analysis and captivating Tableau visualizations, we've uncovered insights into net production dynamics, renewable energy trends, and state-level energy generation.
Exploring the Relationship Between IQ Scores, Economic Development, and Geographical Factors
Tool: R | Excel | Tableau
This project explores the relationship between average IQ and average GDP across different continents. Through rigorous data analysis, we uncover nuanced correlations and emphasize the need for region-specific approaches to address cognitive and economic dynamics.
The findings offer valuable insights for policymakers, educators, and researchers, shaping evidence-based interventions and policy recommendations aimed at fostering cognitive and economic development.
Contact
Feel free to reach out to me to discuss collaboration, career opportunities, or any inquiries. You can contact me at my Email for written communication or connect with me my social medias . I'm always eager to engage in meaningful conversations and explore new opportunities in the tech industry.